


















Your customer-facing teams handle millions of conversations a quarter. Compass reads every one of them and shows you the pattern your CSAT survey only hints at.
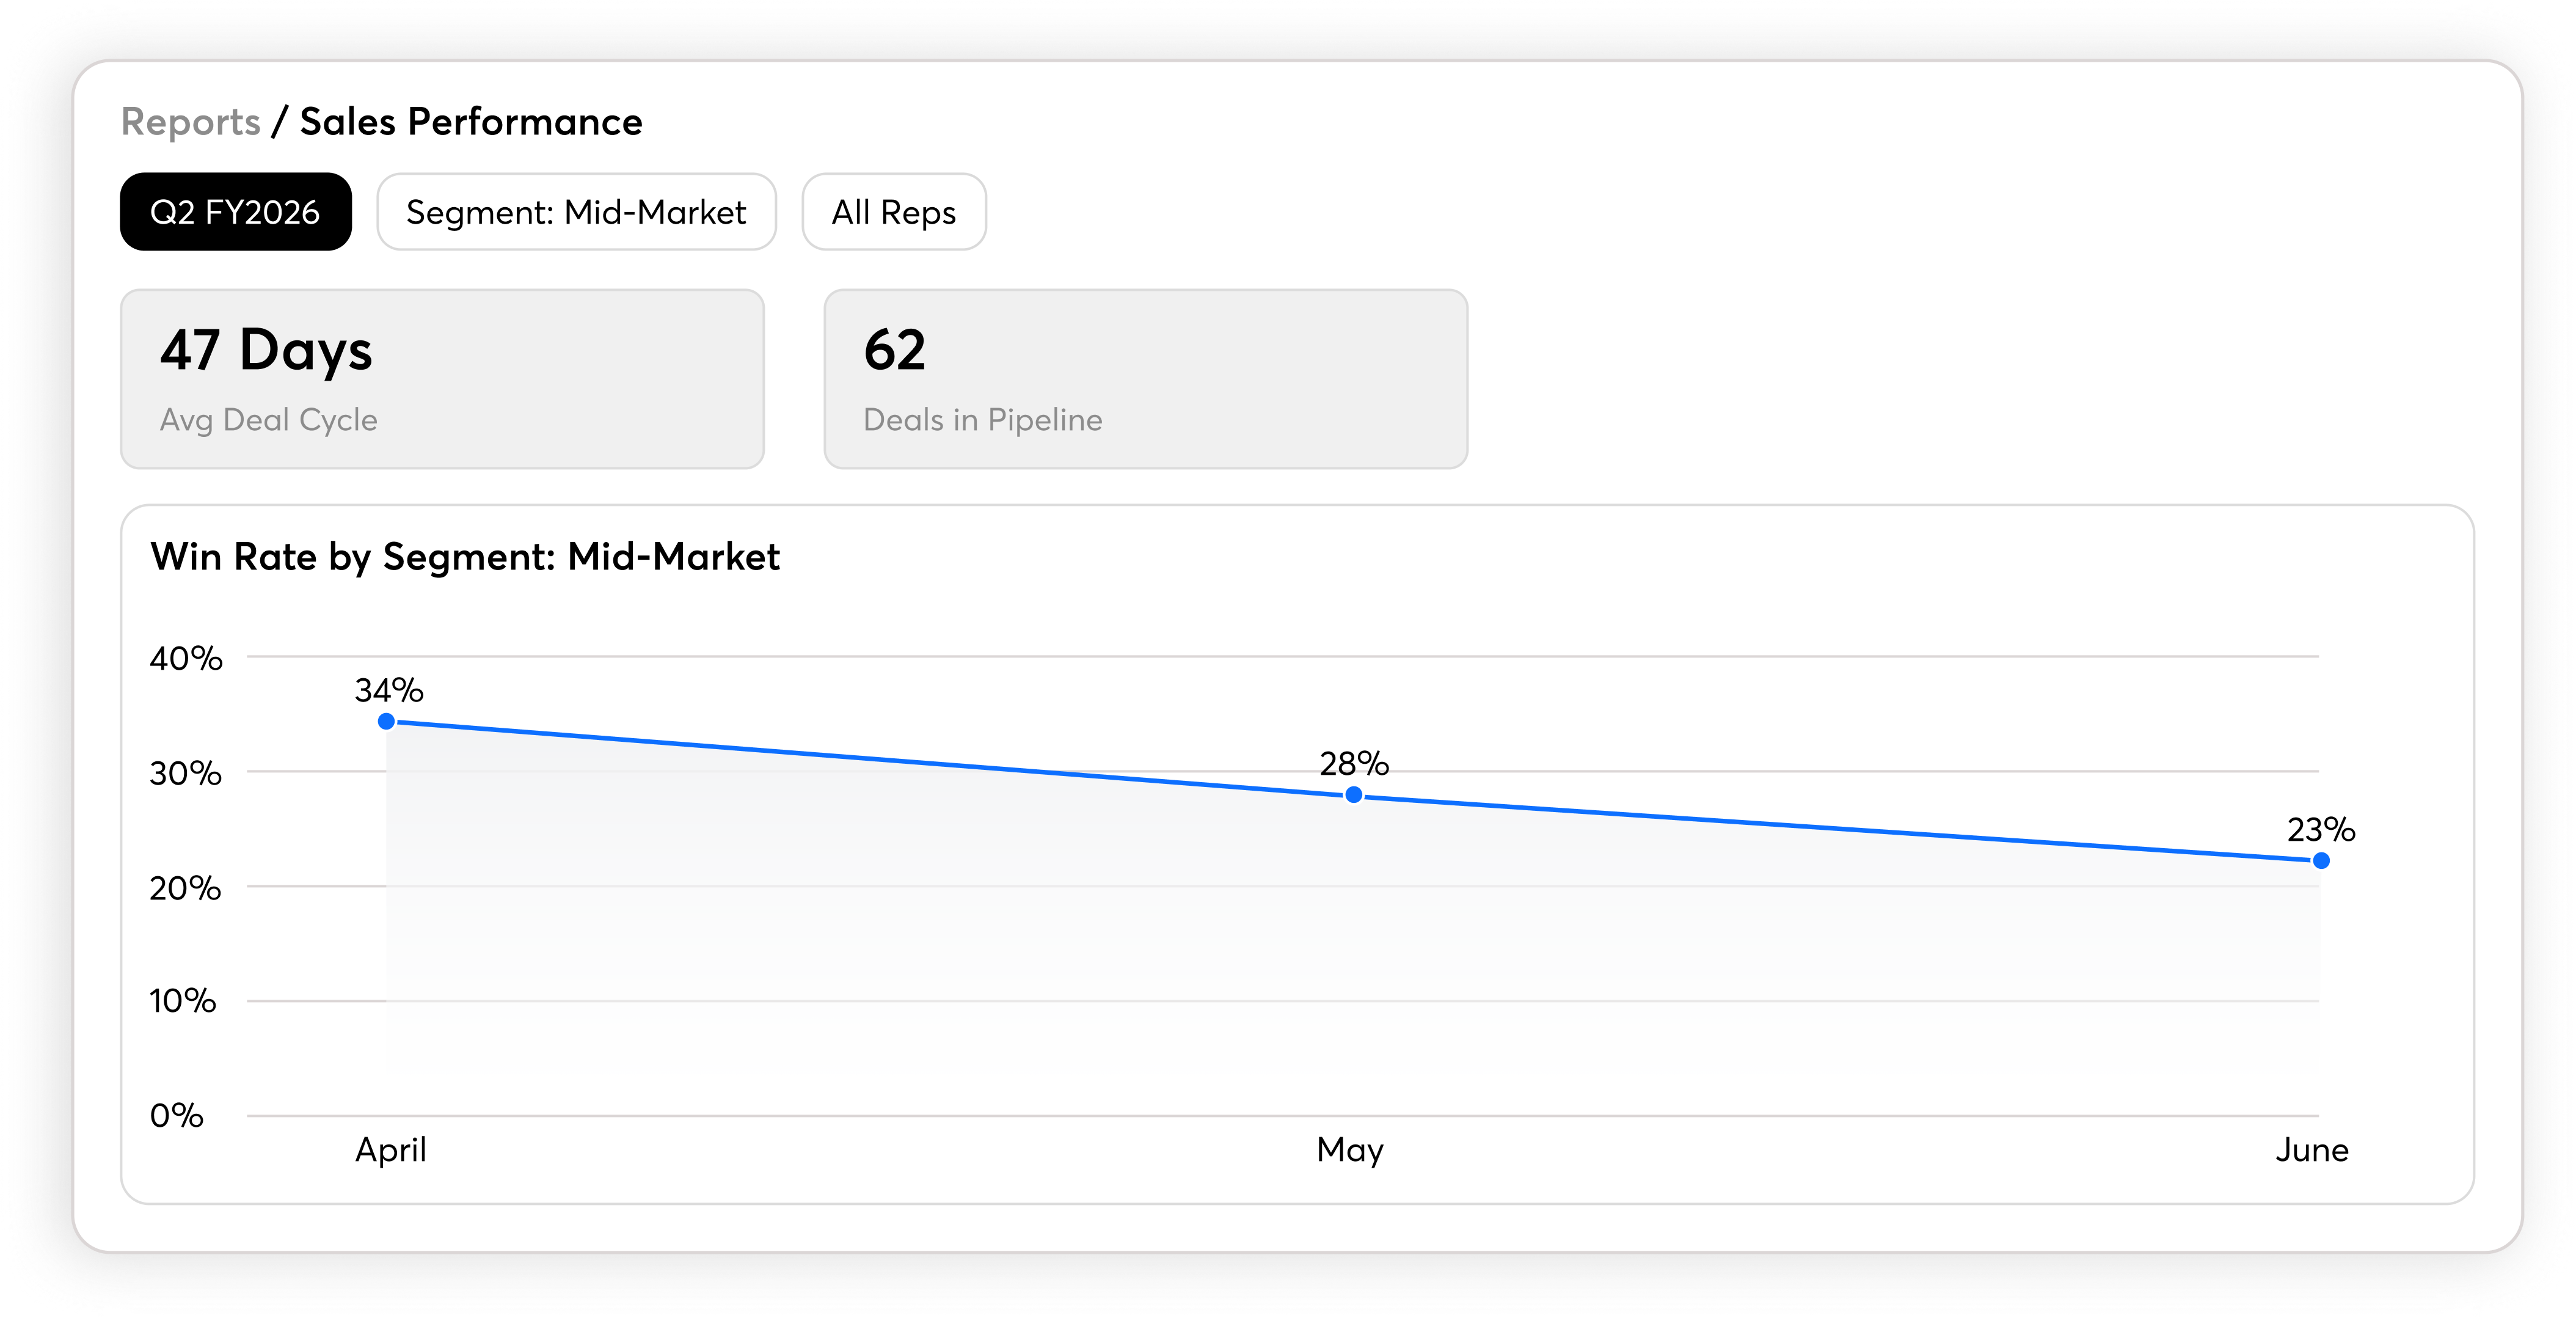
Your week opens with a CSAT report. The trailing-30 number is down four points. The verbatims say things like "agent was nice but couldn't help" and "had to call three times." Your director wants a root cause by Friday. You have a million customer conversations a quarter and a QA team that listens to maybe two thousand of them.
So you do what you always do. You pull a sample. You read the verbatims that came in. You ask supervisors what they are hearing on the floor. You check AHT and occupancy with WFM. By Wednesday you have three theories and no evidence. By Friday you write the deck anyway because the meeting is on the calendar.
This is the job for CX leaders running high-volume customer operations across retail, telecom, e-commerce, hospitality, cable, media, and travel. You are accountable for CSAT, CES, NPS, FCR, repeat contact rate, and escalation rate. Your survey response sits between four percent and twenty percent depending on the industry, and the people most likely to churn are the ones who never answered. Your headline number is a self-selected sliver. The other ninety-plus percent of customer interactions are invisible to the metric driving your quarterly review.
The pattern that explains the drop is almost never in the sample. It is in the calls about the new return policy that nobody flagged. It is in the chats where the bot handed off mid-sentence and the agent had to start over. It is in the third call from the same customer about the same order, where the agent solved it cleanly and the customer is writing a one-star review anyway. It is in the calls about a delayed delivery, a missing reservation, a billing surprise after a promo ended, a modem swap that went sideways. Sampling cannot see systemic patterns. It was not built to.
A two percent sample of a million conversations is twenty thousand calls. Sounds like a lot. It is not. If a complaint pattern touches three percent of your volume, your sample catches six hundred of those calls scattered across products, channels, regions, sites, and agents. By the time QA rolls up the trend, the launch has shipped, the holiday is over, or the policy change has already done its damage.
The things that move CSAT in B2C are systemic and slow. A new carrier in one region drives a wave of "where is my order" calls that each resolve on first contact and each generate a follow-up three days later when the package has not moved. The agent does nothing wrong. Repeat contact rate climbs. FCR looks fine because each call closed cleanly and the agent disposition-coded it as resolved under handle-time pressure. Nobody catches it for six weeks.
Or this. Your size guide has an error, your loyalty program changed its tier rules, your hotel brand reorganized its cancellation policy. Agents improvise the same fix in slightly different ways. Some offer a refund. Some recommend a workaround. Some escalate because the policy edge is ambiguous. CSAT drifts down. Escalations climb. Your scorecard says agents are fine because they are following the rules they have. The rules are the problem and the sample will not tell you that.
Sampling also misses the soft moments that move NPS. The empathy beat in the first ninety seconds when a customer mentions an outage during a storm or a charge that hit at the worst time. The acknowledgment when a customer has been with you fourteen years. The credit offered before the customer has to ask. These are the difference between a seven and a nine.
Customer experience is one of the most opinion-rich functions in any company. Every executive has been a customer. Every executive has a theory about what good service sounds like. Every executive has an anecdote from a call they overheard, a bad experience a friend had, a social post that went viral last week. You cannot run a CX program on anecdotes and you cannot defend one with sampled scorecards.
The current evidence base for most CX organizations is survey data with self-selection bias, QA scores from a two percent sample, and disposition codes entered under AHT pressure. None of those hold up under scrutiny. When the CFO asks why a campaign drove a CSAT drop, "our scores went down" is not a finding. When the COO asks whether retention training worked, a calibration meeting where four QA leads disagree on a save attempt is not an answer. When a BPO partner disputes a performance issue, three sampled calls is not a case.
Evidence also changes the budget conversation. In high-volume B2C, the cost of a bad experience is not a low CSAT score. It is a churn event, a canceled subscription, a guest who books a competitor next time, a customer who switches providers when their contract is up, a public review that does work against you for years. Walk in with the specific behavioral patterns driving CSAT and the conversations that show them, and the discussion moves from "your scores are flat" to "here is the chain from support friction to retention."
Reviewers are humans on a Monday morning. Their scores drift by mood, time of day, familiarity with the agent. Behavioral evidence does not drift. The same call gets the same scores every time. The acknowledgment moment landed or it did not. The recovery phrase rebuilt trust or it did not.
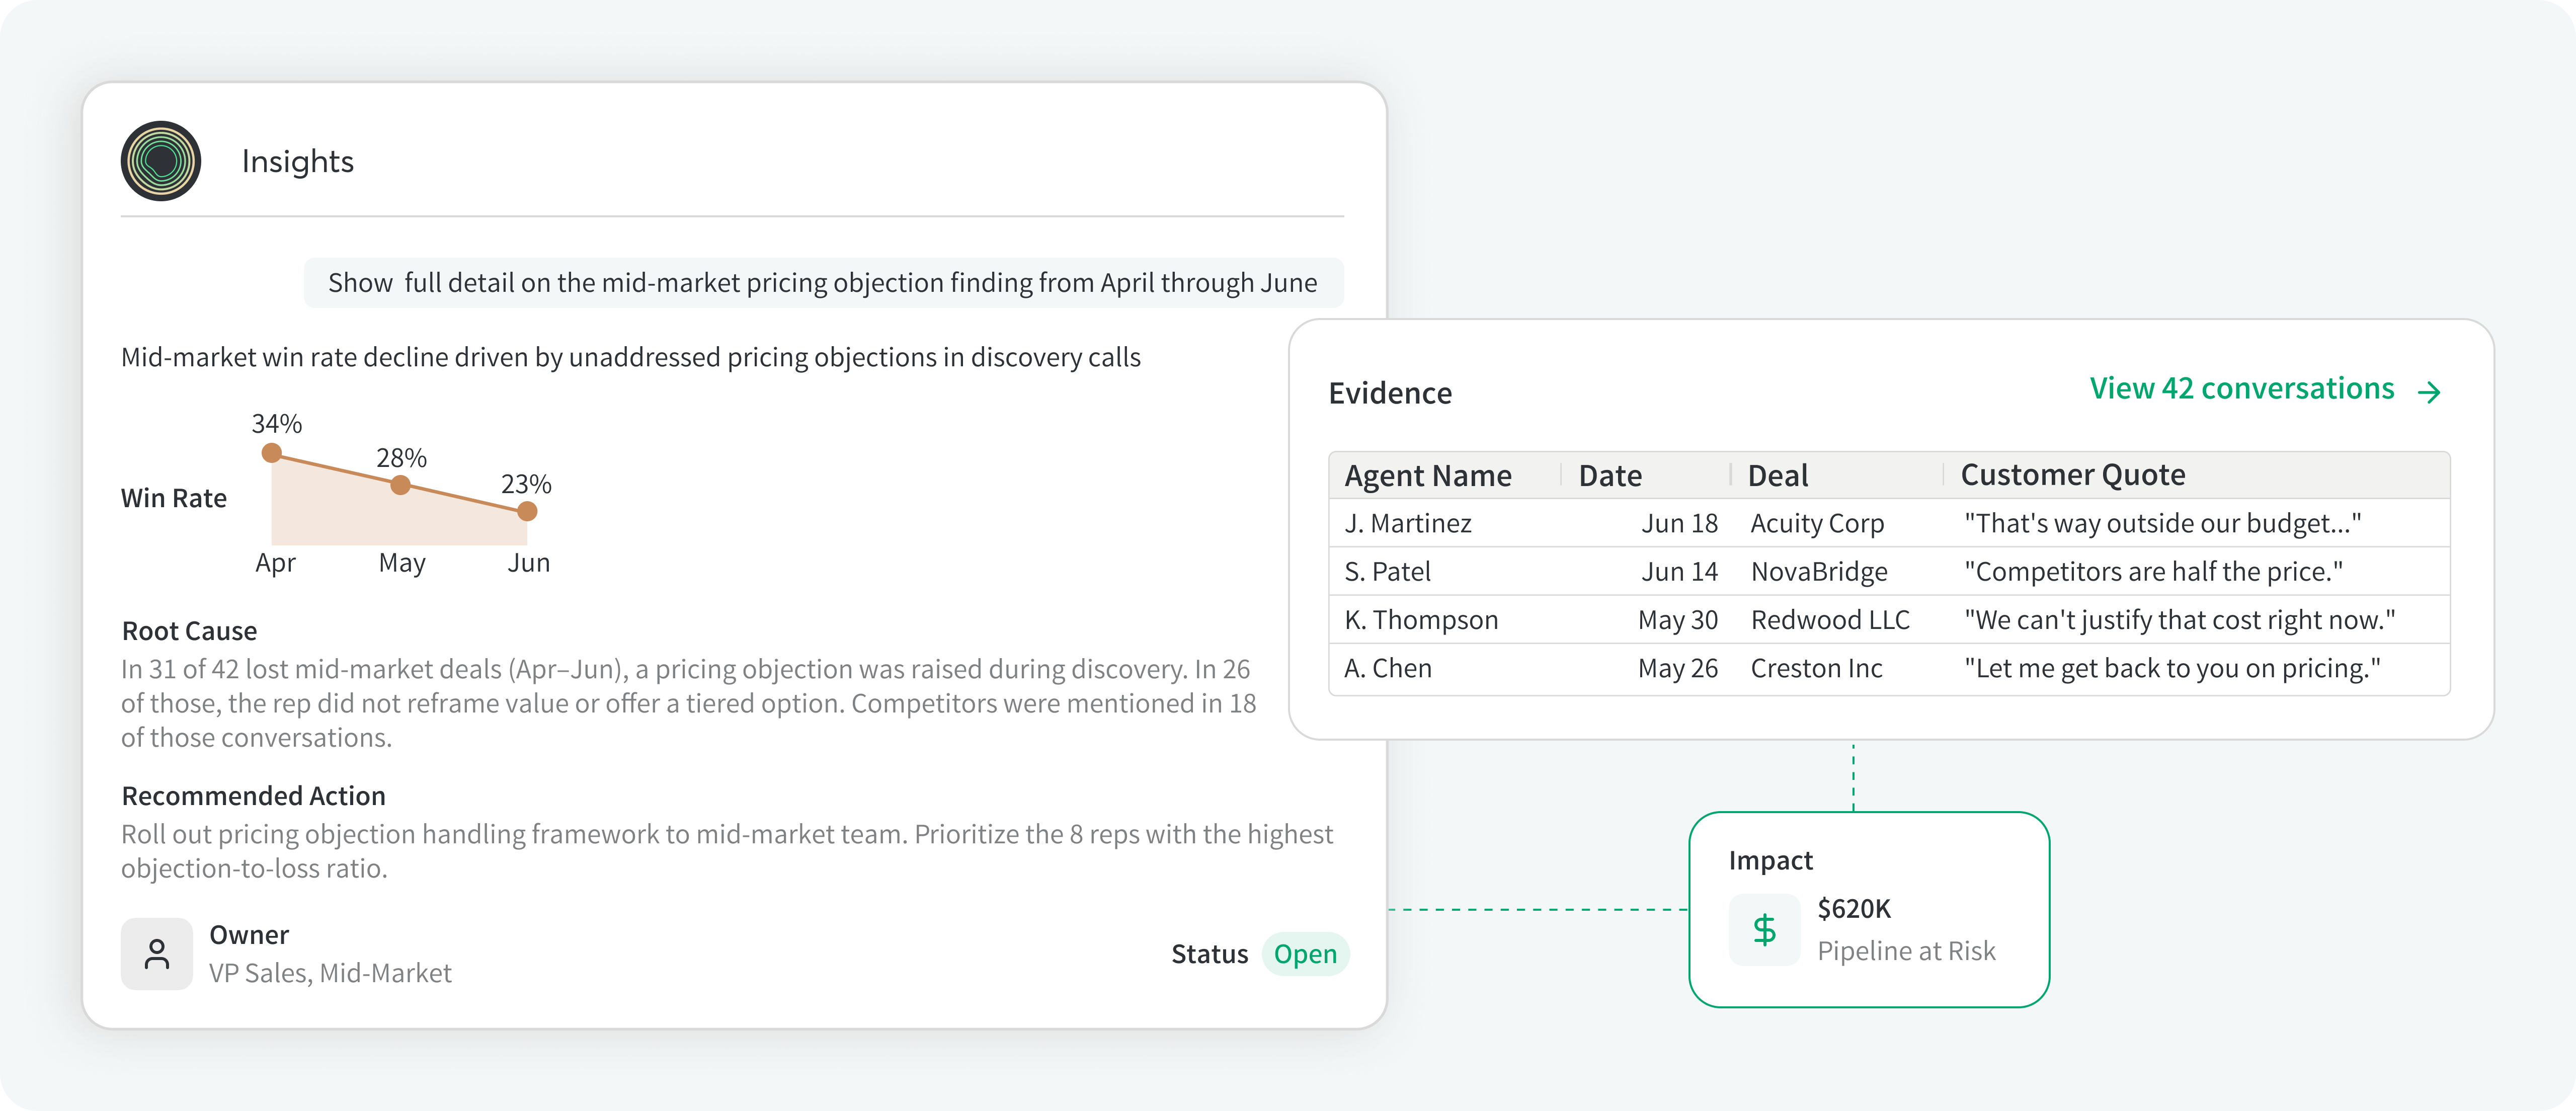
Compass reads every customer conversation across voice, chat, and email, then extracts a structured layer. Conditions describe what was factually true about the conversation (customer, account, product, intent, channel, prior contact history). Signals are roughly one hundred and thirty behavioral patterns scored zero to one (acknowledgment, ownership, recovery language, effort recognition, loyalty acknowledgment, script adherence, and more). Outcome Lift adjusts for difficulty so two agents handling the same call type are compared on the customer they actually got. Guidance turns the result into a coaching moment a supervisor can use.
The customer behind those conversations is resolved as one entity across channels. A guest who called Tuesday, chatted Wednesday, and emailed Friday is one journey, not three tickets. We call this contextual entity resolution, and it is what makes repeat contact analysis honest.
Conversation Insights is the primary pillar. The other three come in once you want to turn the pattern into a coaching move, a script update, or a CSAT story you can defend in a leadership review.
Q: We already have a QA team and a scorecard. What changes? A: Your QA team stops scoring a sample and starts working from the patterns Compass surfaces. The scorecard does not have to go away on day one. Most teams keep it for a quarter or two, watch which items correlate with outcomes, and let the dead weight fall off.
Q: How does this work with our recording and engagement platform? A: Compass connects to the major cloud customer-engagement and recording platforms through standard integrations. We work with the audio and metadata you already capture. No rip and replace.
Q: What about chat, email, and social DMs? Most of our volume is digital. A: Compass treats chat and email as first-class conversations with the same behavioral patterns calibrated to the channel. A customer who chatted Monday and called Wednesday is one journey. Social DM ingestion depends on your platform and is scoped case by case.
Q: How do you handle multiple languages? A: Compass supports multilingual transcription and signal extraction in the major customer-service languages, with strongest coverage on English and Spanish. We share the current matrix in the first working session.
Q: How does this handle BPO and outsourcer sites? A: One of the higher-value applications. Compass treats each site and BPO as a comparable unit. You see drift, adherence, behavioral patterns, and Outcome Lift by site and team. Conversations you cannot listen to directly become as visible as those in your own building, which changes both the QA conversation and the contract negotiation.
Q: What about recording consent and two-party-consent states? A: Compass works on conversations you have already lawfully recorded under your existing consent practice. We do not change your consent posture or introduce a new recording obligation. We sign standard paperwork (NDA, DPA, and a BAA where PHI is in scope). No customer data is used to train models that serve other customers. SOC 2 is in progress. Vendor security documentation and subprocessor details are available on request during your security review.
Q: How is this different from speech analytics we already evaluated or use today? A: Traditional speech analytics surfaces keywords and phrases. Useful, not enough. Compass extracts structured Conditions, Signals, and Outcome Lift, so you can ask "what behavior actually moves CSAT on our refund calls" instead of "which calls contain the word refund." Most teams that adopt Compass displace or wind down a legacy speech analytics line item over the first or second renewal cycle.
Q: How long until we see something useful? A: The first systemic pattern usually surfaces in the first few weeks, before the platform is fully tuned. We start with a defined slice (one product line, one site, one peak period) and expand from there.
Q: Do we need clean contact reasons to start? A: No. Compass derives contact reasons from the conversation. If your existing categorization is good, we map to it. If it is unreliable, the Compass-derived view becomes your source of truth.
Bring a CSAT drop you cannot explain or a repeat-contact pattern that has been sitting on your list for a month. We will spend thirty minutes on it together. If you want to look at your own conversations, NDA comes first; until then we work from a sandbox of shared examples. You leave with a few patterns worth pulling on.